NSE Unlisted Share Price
₹3175
*Average Price as per 23 February, 2025
Fundamentals
FACE VALUE
1
BOOK VALUE
96.8
NO OF SHARES
2475000000
EPS
33.55
SALES
16352
INDUSTRY PE
82
DIVIDEND
18
DIVIDEND YIELD
1.04
PE
51.71
PB
17.92
PS
26.26
MARKET CAP
429412.5
EQUITY
247.5
PAT
8306
MESSAGE
2023-24
OVERVIEW
1992 saw the incorporation of NSE. SEBI registered it as a stock exchange in April 1993. The wholesale debt market and the cash market segment were introduced shortly after, marking the beginning of the exchange's activities.
1993: India recognises NSE as an exchange
1994: Screen based trading introduced by NSE
2000: The NSE introduced index futures, opening up trade in derivatives in India.
2002: The NSE launched ETFs in India.
2008: The NSE introduced currency futures to India.
2011: Started trading on the FTSE Index index futures and options contracts.
2016: Promoted NSE IFSC, the international stock exchange in India’s first IFSC SEZ at gift city Gandhinagar
2021: The number of NSE registered investors exceeds 5 crore individual investors.
Landscape
of exchanges in India
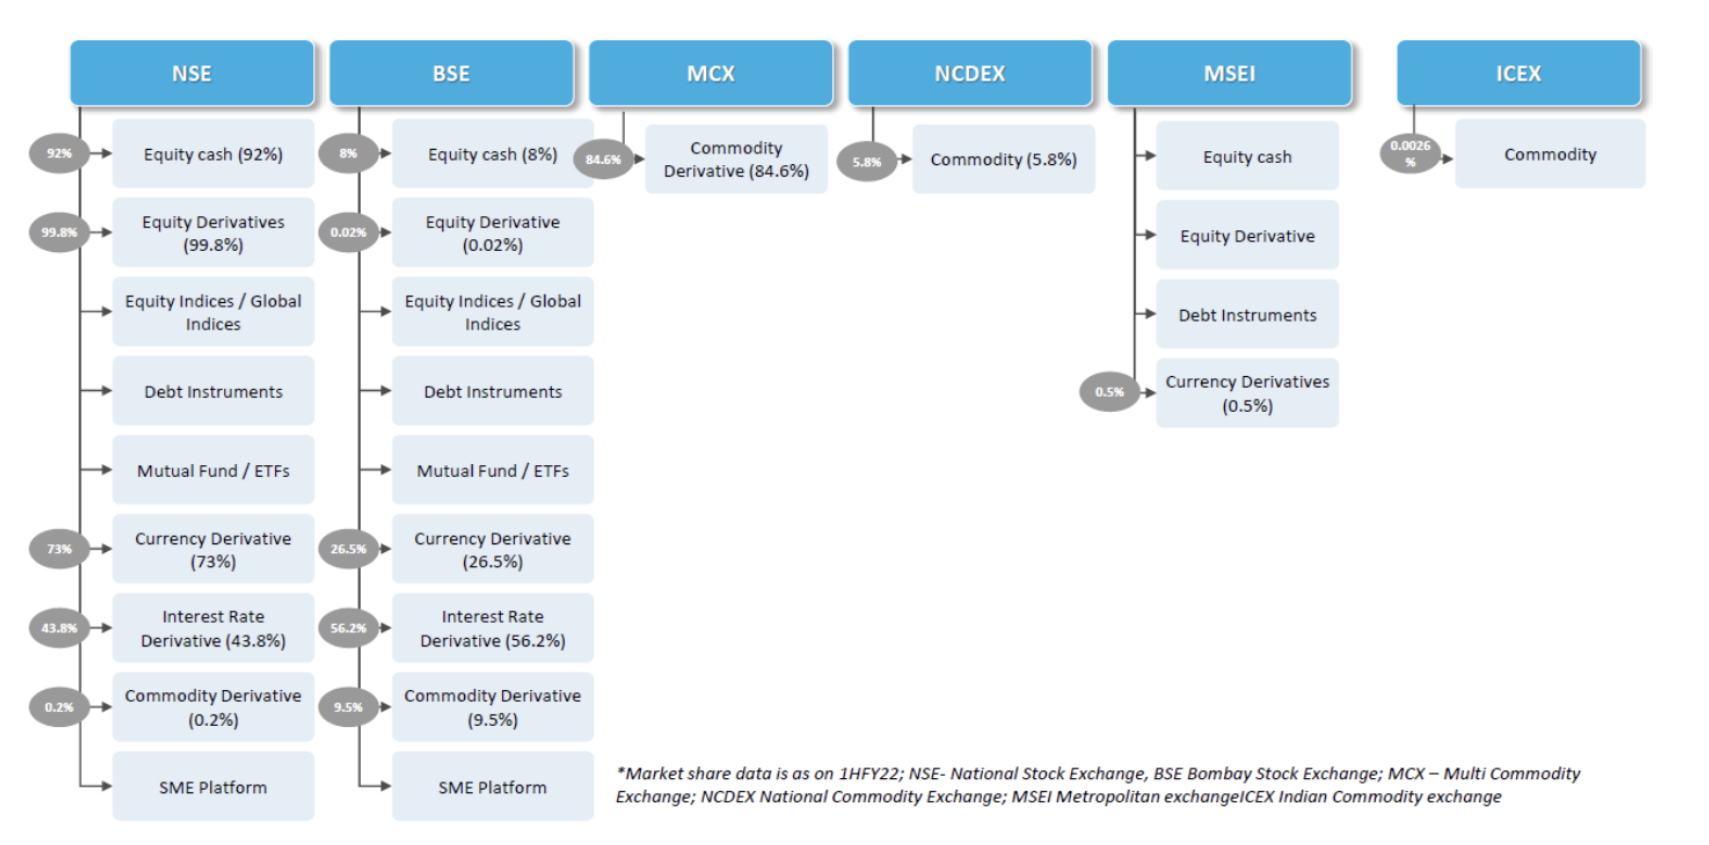
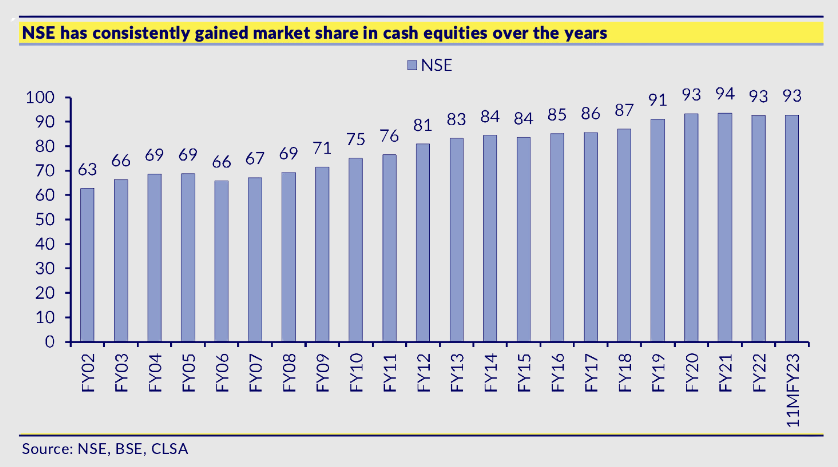
Over the previous 20 years, NSE's market share in cash equities has increased steadily, rising from 63% in FY02 to 81% in FY12 and then to 92% in FY22. Due to an increase in algorithmic (algo) trading with the introduction of co-location facilities in 2009, the company's market share experienced a dramatic surge in the following years.
Revenue Model
Unlike global exchanges, NSE have high dependency on transaction charges: while BSE’s dependence is low due to poor market share. Learn more about NSE business model here.
Transaction
Charges
- Charges according to turnover in different categories
- Connected to the volume of market activity, family investments, and savings
Treasury
income on clearing and settlement funds
- Income from clearing corporation
- Interoperability related income
- Interest income from SGF gets added to the SGF account
- Linked to interest rates and to an extent market activity since that would lead to more margin being deposited by members
Tech and
information solutions
- Colocation, Network, Platform and terminal charges
- primarily consists of charges recovered from members for network connectivity
Services to corporates
- Listing fees
- Book building fees
- Mostly derived from listing income that is not impacted by market activity
- Book Building is linked to primary fund raising
Data dissemination
fees
- Live Data feeds to third party aggregators
- Historical data for back testing
- Impacted primarily due to level of subscriptions and revision in pricing policies
Income from Investments
and deposits
- Income from own cash (not clients money)
- Linked to investment yields
Other Income
- Recurring in Nature
- Mostly derived from rent and training institution, etc
Low participation in capital markets
An increase in corporate activity is anticipated in the market.
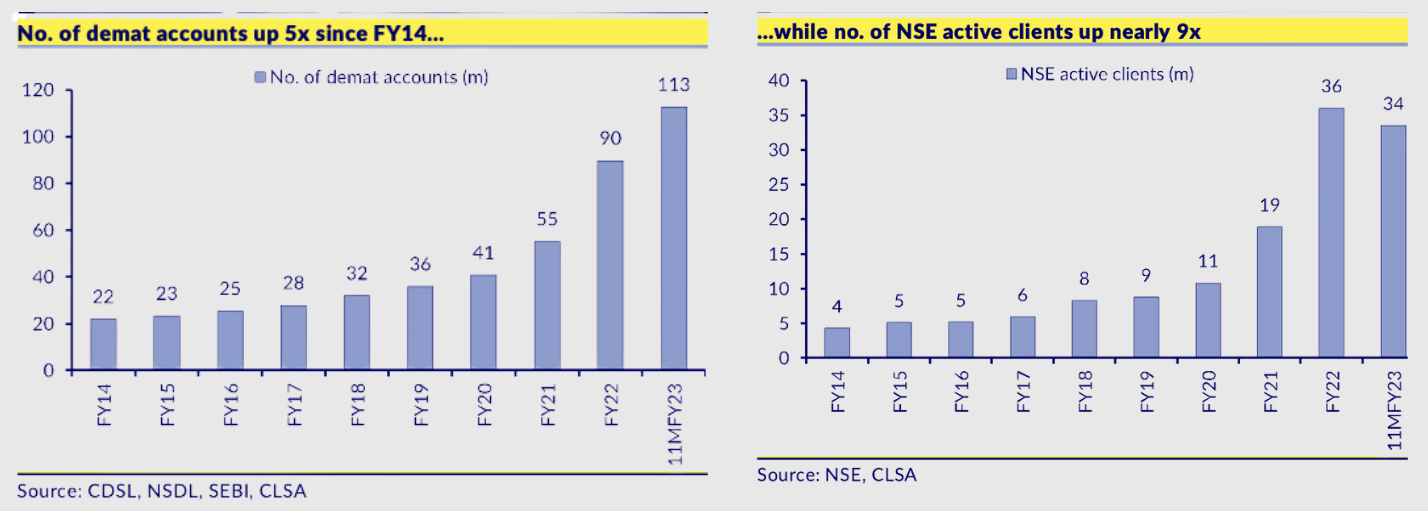
NSE experiencing strong client growth
Demat account ownership has surged in India, growing fivefold from 2.2 crore in FY14 to a staggering 11.3 crore currently. Interestingly, while demat accounts have boomed, NSE's active user base has witnessed an even sharper rise, nearly multiplying by 9 times, from 40 lakh in FY14 to 3.4 crore today.
NSE is growing its dominance in the stock exchange market
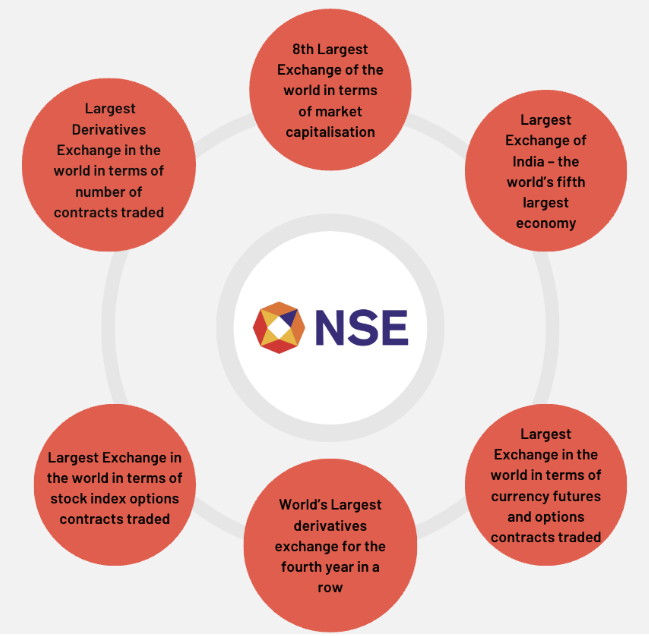
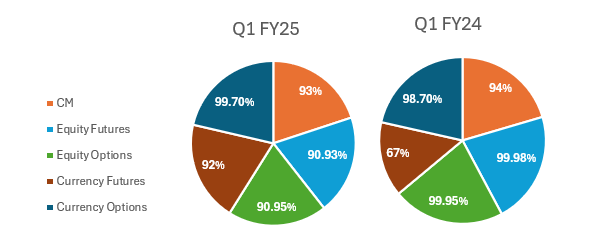
The National Stock Exchange (NSE) boasts a commanding presence in the Indian market, with 93% of cash segment activity and a near-monopoly (99%) in the F&O (Futures & Options) segment. Learn more about the world's most valuable stock exchanges in 2024.
INSIGHT
Financial Highlight
Total Income: ₹4,807 Cr, up 21% YoY, but down 4% QoQ due to a revenue dip.
Operating EBITDA: ₹3,398 Cr, showing 50% YoY growth and 2% QoQ increase, reflecting cost efficiencies.
Profit After Tax (PAT): ₹3,834 Cr, a massive 94% YoY jump and 22% QoQ growth, driven by strong earnings.
Earnings Per Share (EPS): ₹15.49, nearly 2x YoY growth (vs ₹7.98 in Q3 FY24), enhancing shareholder value
NSE Q1 FY25 Standalone Segmental Revenue
| Revenue Drivers (in Cr.) | Q1 FY25 | Q1 FY24 | Y-o-Y Growth |
| Transaction Charges | 3623 | 2525 | 43.49% |
| Treasury Income | 340 | 303 | 12.21% |
| Data center & Connectivity Charges | 260 | 194 | 34.02% |
| Listing Services | 67 | 45 | 48.89% |
Market Share of NSE after Q1 FY25
Financial Insights
| Particulars (in Cr.) | FY24 | FY23 | FY22 |
| Total Revenue | 16,352.00 | 12,765.00 | 8,874.00 |
| EBITDA | 11611 | 9428 | 6,499.26 |
| PAT | 8306 | 7356 | 5,198.29 |
| EPS | 167.80 | 148.61 | 105.02 |
| Dividend | 90 | 80 | 42 |
- NSE's revenue in FY24 grew at a compound annual growth rate (CAGR) of 28%, while its profit after tax (PAT) saw a CAGR of 13%
- NSE is rewarding shareholders with a double dose of good news! They've declared a final dividend of Rs. 90 per share (pre-bonus) along with a generous bonus issue of 4 shares for every 1 share currently held.
Learn more about NSE bonus issue.
Segment wise revenue split
The company saw a 59% jump in revenue and a 41% increase in PAT in FY-23 compared to FY-22.
Particulars | FY-23 | FY-22 |
Trading Services | 10173 | 6965 |
Colocation Charges | 614 | 433 |
Data feed services | 273 | 225 |
Listing services | 180 | 184 |
Index Licensing Services | 150 | 116 |
Strategic Investments | 328 | 256 |
Other Segments | 1047 | 695 |
Total | 12765 | 8874 |
Unpacking the rise in options volume
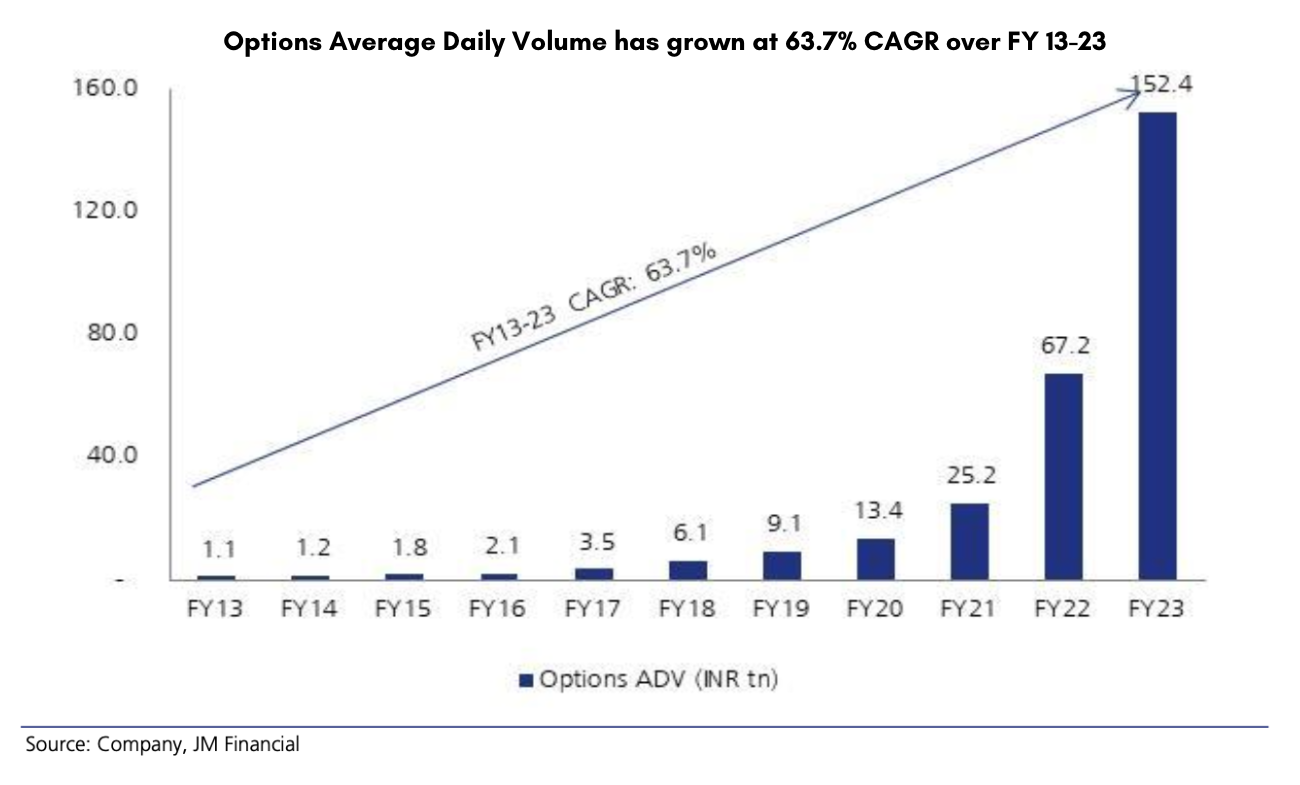
Equity options trading in India has seen a dramatic increase, with the average daily volume surging 25 times over the past 5 years to a staggering INR 152.4 trillion. This surge can be attributed to a confluence of factors:
Regulatory changes: In 2020, SEBI's Peak Margin Rule restricted the leverage offered by brokers, bringing it down from a maximum of 100 times to just 5 times in 2021. This significantly reduced the appeal of intraday trading and futures contracts, pushing investors towards options.
- Rise in retail participation: The pandemic led to a surge in new demat accounts, and many online influencers have been promoting options trading. This increased investor base has contributed to the higher options volume.
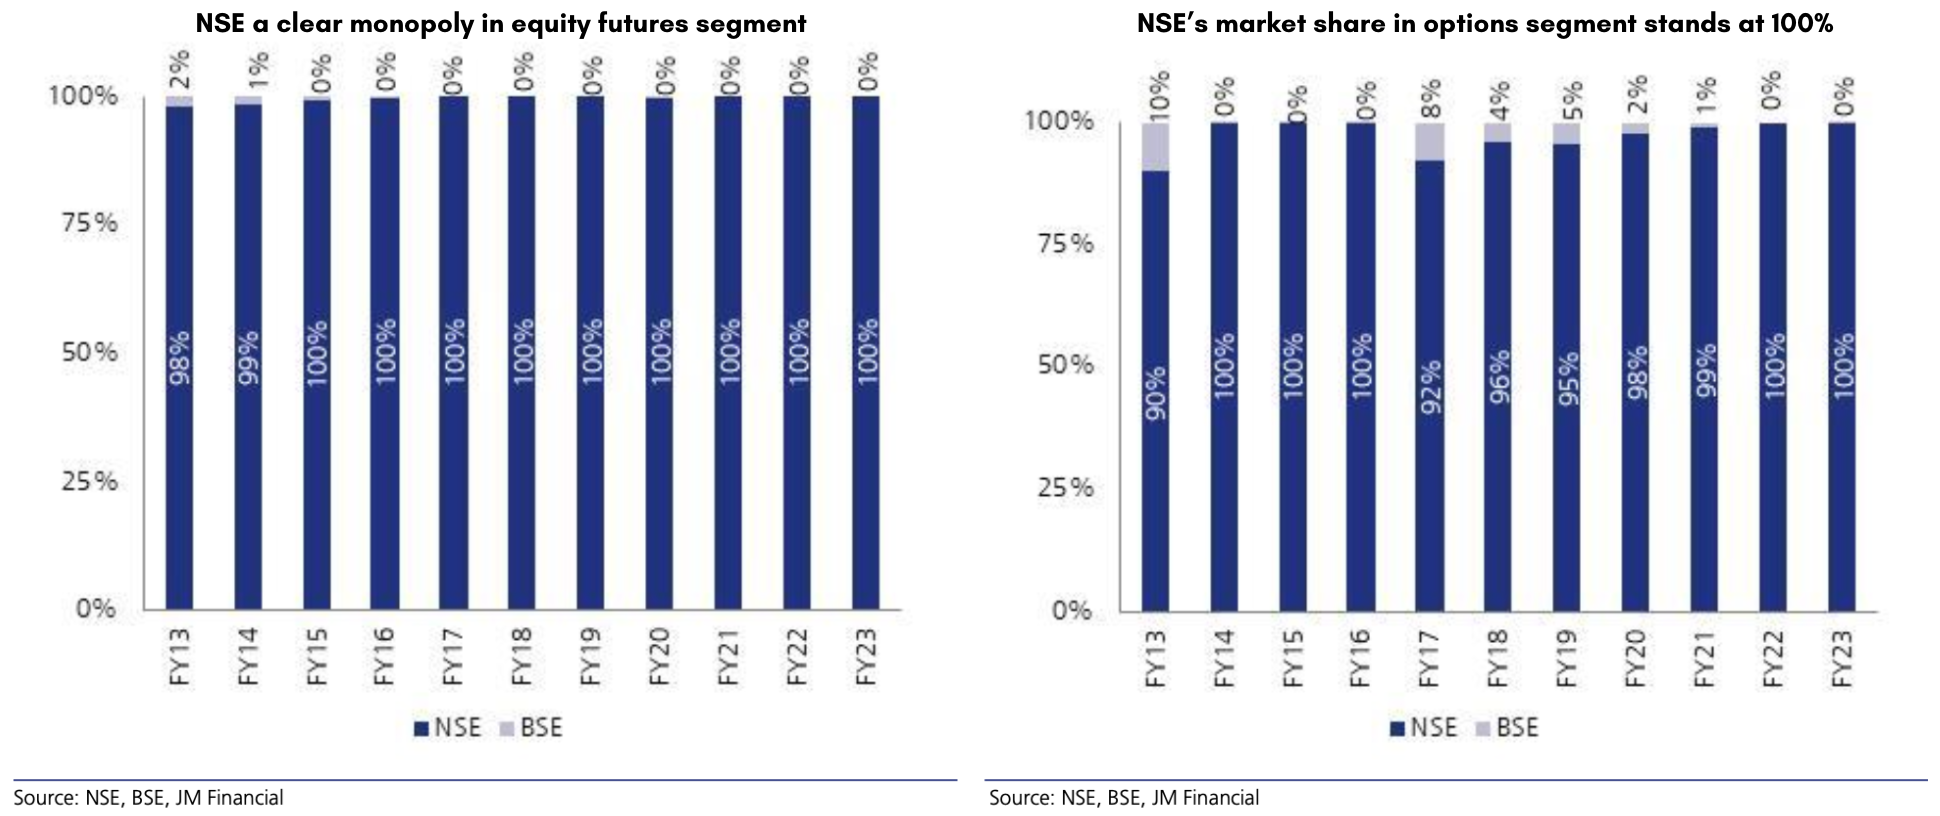
NSE dominates the equity derivatives market, holding a 100% market share. Equity options and futures contributed significantly to FY23 transaction income, accounting for 76% and 12% respectively.
A Comprehensive Analysis of Transaction Fees
Transaction income the dominant revenue driver for NSE
NSE relies heavily on transaction fees (including clearing fees) for its revenue, averaging around 79% over the past three fiscal years (FY21-23). This dependence is higher than BSE's due to lower trading volumes on the latter exchange.
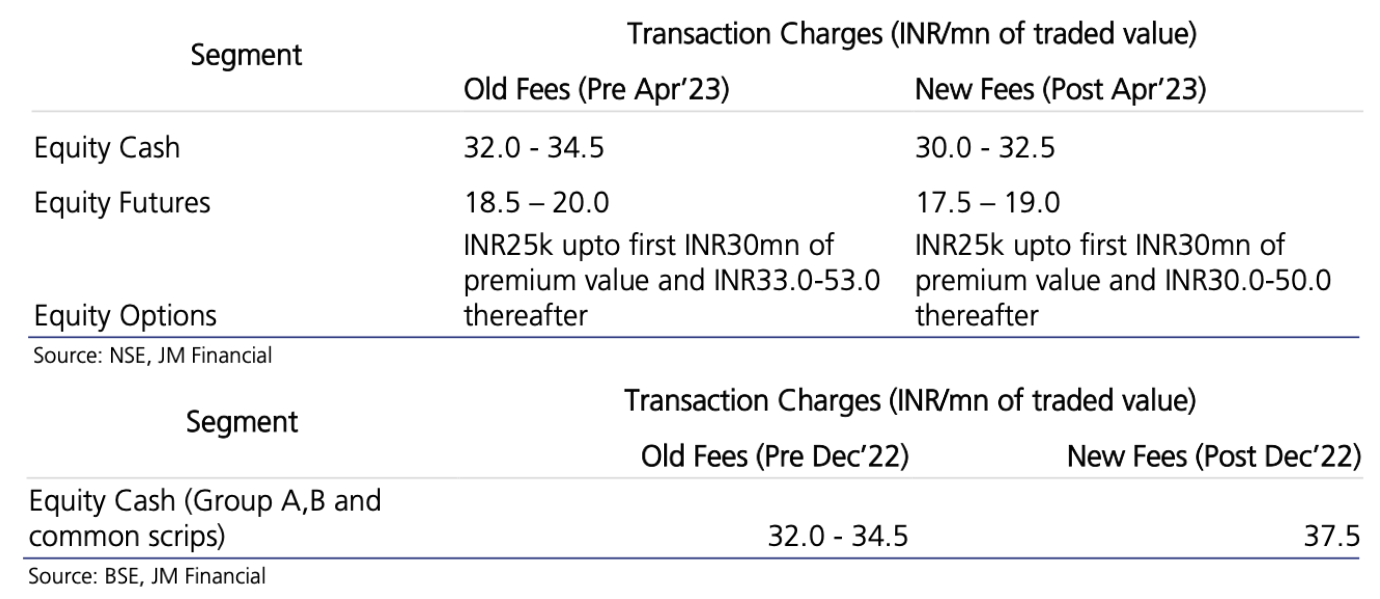
Transaction fees are essentially brokerage charges based on the type of product and trade size. Both NSE and BSE have fee structures that vary by product segment and depend on the traded value. While NSE offers competitive fees for stock trading (cash segment), they charge significantly more for derivatives compared to BSE, likely due to their dominant market position in that area.
While exchanges generally aim for stable fee structures across their products, recent changes show some flexibility. NSE, for example, rolled back a December 2020 transaction fee increase of 6% for equity cash and derivatives after building the required INR 15 billion Investor Protection Fund corpus. Conversely, BSE went the other way, raising its charges in December 2022.
NSE India Conference Call Takeaways FY-24
- Leading Derivatives Exchange: NSE remains the world's largest exchange for derivatives contracts for the fifth consecutive year.
- Strong Cash Market Presence: NSE holds the third position globally in terms of the number of cash segment trades.
- Growth in Gift City: The international exchange at Gift City is experiencing significant growth, reaching INR 3.5 trillion in open interest contracts.
- Dominant Clearing Market Share: NSE maintains a dominant position in clearing, with a 93% share in cash, 96% in derivatives, and 85% in currency segments.
- Investor Rewards: The company plans to issue bonus shares and maintain a strong dividend payout policy.
- Transfer Process Improvement: NSE is working on automating the share transfer process to reduce the current timeframe of 4-5 months.
Read more about NSE India’s 4QFY24 Conference Call.
NSE Gift City Opportunities
GIFT City holds the potential to be a game-changer..

NSE Backed by Marquee Investors
Name of the shareholder | Shareholding percentage |
LIC | 10.72 |
Aranda Investments Ltd | 5 |
Stock Holding Corporation of India Ltd | 4.44 |
SBI Capital Markets Ltd | 4.33 |
Veracity Investments Ltd | 3.93 |
SBI | 3.23 |
Crown Capital Ltd | 3.17 |
PI Opportunities Fund | 3.00 |
TA Asia Pacific Acquisitions Ltd | 2.33 |
MS Strategic Ltd | 2.30 |
Peer Comparison

The unresolved NSE Colocation issue casts a shadow on its IPO plans
A cloud hangs over the National Stock Exchange (NSE) with the colocation scandal. This controversy centers on accusations of unequal access to market data and trading systems for some high-frequency traders (HFTs).
Colocation, where traders house their servers near the exchange, can provide a speed advantage in HFT. The allegations claim that select HFTs received preferential access to NSE's systems, potentially giving them an unfair edge over others. This raises serious concerns about the fairness and integrity of the market.
SEBI, India's market regulator, is investigating these claims, focusing on whether NSE officials granted special treatment to certain brokers, allowing them faster access to market data. The investigation is ongoing, with several developments and legal proceedings taking place. Read more about NSE IPO Insights and Expectations
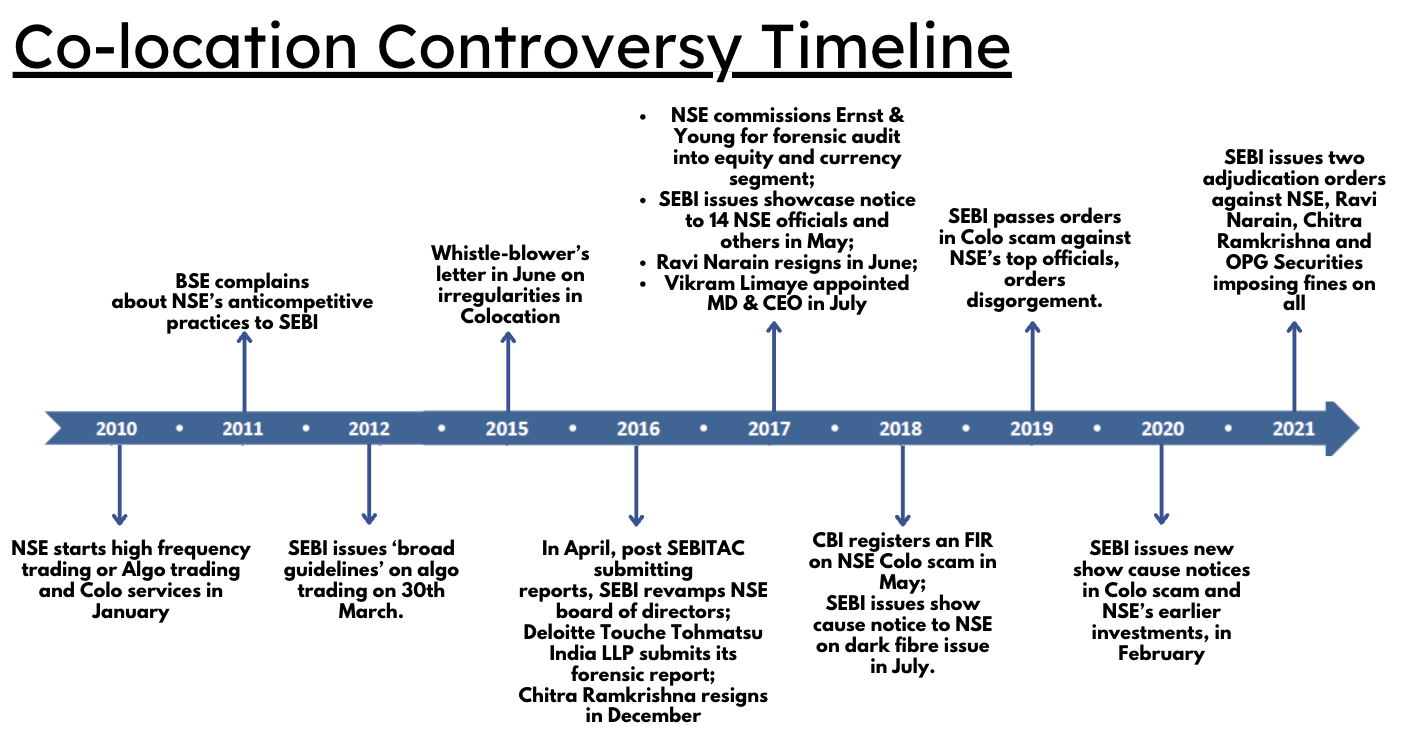
2022: Court sends Chitra Ramkrishna to judicial custody under the money laundering act.
2023: SC directed the market regulator to refund the NSE Rs 300 crore deposited under disgorgement orders.
NSE IPO Plans

NSE's IPO Journey
- Stalled by Controversy In December 2016, NSE planned a giant IPO (₹10,000 crore) where existing shareholders would sell their shares (OFS). However, the offering was scrapped due to allegations of unfair access to trading algorithms for some brokers.
- In January 2020, NSE expressed renewed interest in an IPO, targeting September with SEBI approval. This optimism was short-lived.
- The exchange's listing has been repeatedly delayed due to corporate governance concerns. These include the involvement of former CEO Chitra Ramakrishna in a 2015 market manipulation scandal and ongoing technological glitches.
Valuations
Particulars | NSE | BSE |
CMP (1st April, 2024) | 4500 | 2700 |
Market Cap | 222750 Crores | 36575 Crores |
EPS (TTM) | 157.68 | 56.35 |
P/E (TTM) | 29 | 48 |
P/S | 17 | 40 |
NSE's current price of ₹4500 suggests a significant discount compared to its competitor, BSE, which trades at almost double the price. Interestingly, the Chicago Mercantile Exchange (CME), a globally recognized derivatives exchange with a similar business model and profitability to NSE, trades in a well-established market like the US at a price-to-sales ratio of 14. This comparison raises the question of whether NSE might be undervalued.
NSE Unlisted Share Price Journey
NSE debuted in the unlisted market at ₹1700 per share in March 2021. After a surge to a high of ₹4500 in November 2021, the stock underwent a correction, dipping to ₹3000 by December 2022. However, it has since rallied, reaching a new all-time high of ₹4850 per share in March 2024. Read our comprehensive guide on buying NSE unlisted shares.
Stake Sell by Fairfax India
Fairfax India sold its stake in NSE across Q4 2023 and Q1 2024, expecting to receive a total of $189 million (₹15.7 billion). This is a significant return on their initial investment of $26.8 million. One sale for $132.3 million (₹11.0 billion) was finalized on January 29, 2024, with the remaining transactions expected to close by the end of Q1 2024. At December 31, 2023 there were 105,398,509 subordinate voting shares and 30,000,000 multiple voting shares outstanding.
SECONDARY NAME
ISIN
CDSL
NSDL
INDUSTRY
SECTOR (READ ONLY)
SHARE HOLDINGS
| Name of Shareholder | Holdings |
|---|---|
| Life Insurance Corporation of India | 10.72 % |
| Aranda Investments Mauritius PTE Ltd | 5 % |
| Veracity Investments Limited, Mauritius | 5 % |
| Stock Holding Corporation of India Limited | 4.44 % |
| SBI Capital Markets Ltd | 4.33 % |
| SAIF II SE Investments Mauritius Limited | 3.55 % |
| State Bank of India | 3.23 % |
| Other | 63.73 % |
NRIs invest Before IPO via SB NRI
We're different. SB NRI is the first of it's kind platform built for NRIs offering digital Investment plans.
Schedule a CallTrusted by 1,000s of NRIs spread across the Globe

